Getting mobile metrics into Looker Studio (formerly Google Data Studio) with Supermetrics
Looker Studio is a powerful platform for combining and visualizing data from a variety of sources. Here's everything you need to know to bring your downloads, revenue, reviews, and more into Data Studio using the Supermetrics connector.
First, you'll need a Supermetrics account. You can sign up for one here
In the course of signing up you'll be asked to select a connector (select Supermetrics for Google Data Studio), as well as an integration (select JSON/CSV/XML).
After you select the connector you'll need to authorize Supermetrics to access your Google account, and then authorize the addition of the connector.
Before you set up the connector
In order to use the API you'll need to first create an API client, with a client key and a personal access token. Click here to learn how to generate those.
Setting up the connector for sales data
After you authorize adding the connector, you'll be presented with a configuration screen. Here's how to fill all the required fields:
- Set the Data type to JSON. Although other data types are supported, JSON is the most flexible.
- Set the Source to
https://api.appfigures.com/v2/reports/sales?format=flat&start_date=-30&group_by=date
This will bring in data for the last 30 days broken down by date, for all of your app.
- Set HTTP Headers to
{ "Authorization": "Bearer <token>", "X-Client-Key": "<key>" }.
You should remove the < and > around those objects in your own code.
key is the API you generated earlier, and token is your personal access token for this API key. 4. Check the following options: Convert numeric-looking values to numbers and Convert date-looking values to dates. 5. Click on "Connect"
Supermetrics will now connect to Appfigures and pull downloads, revenue, and other sales data into Data Studio.
There's one more step before you can start using the data in your dashboard.
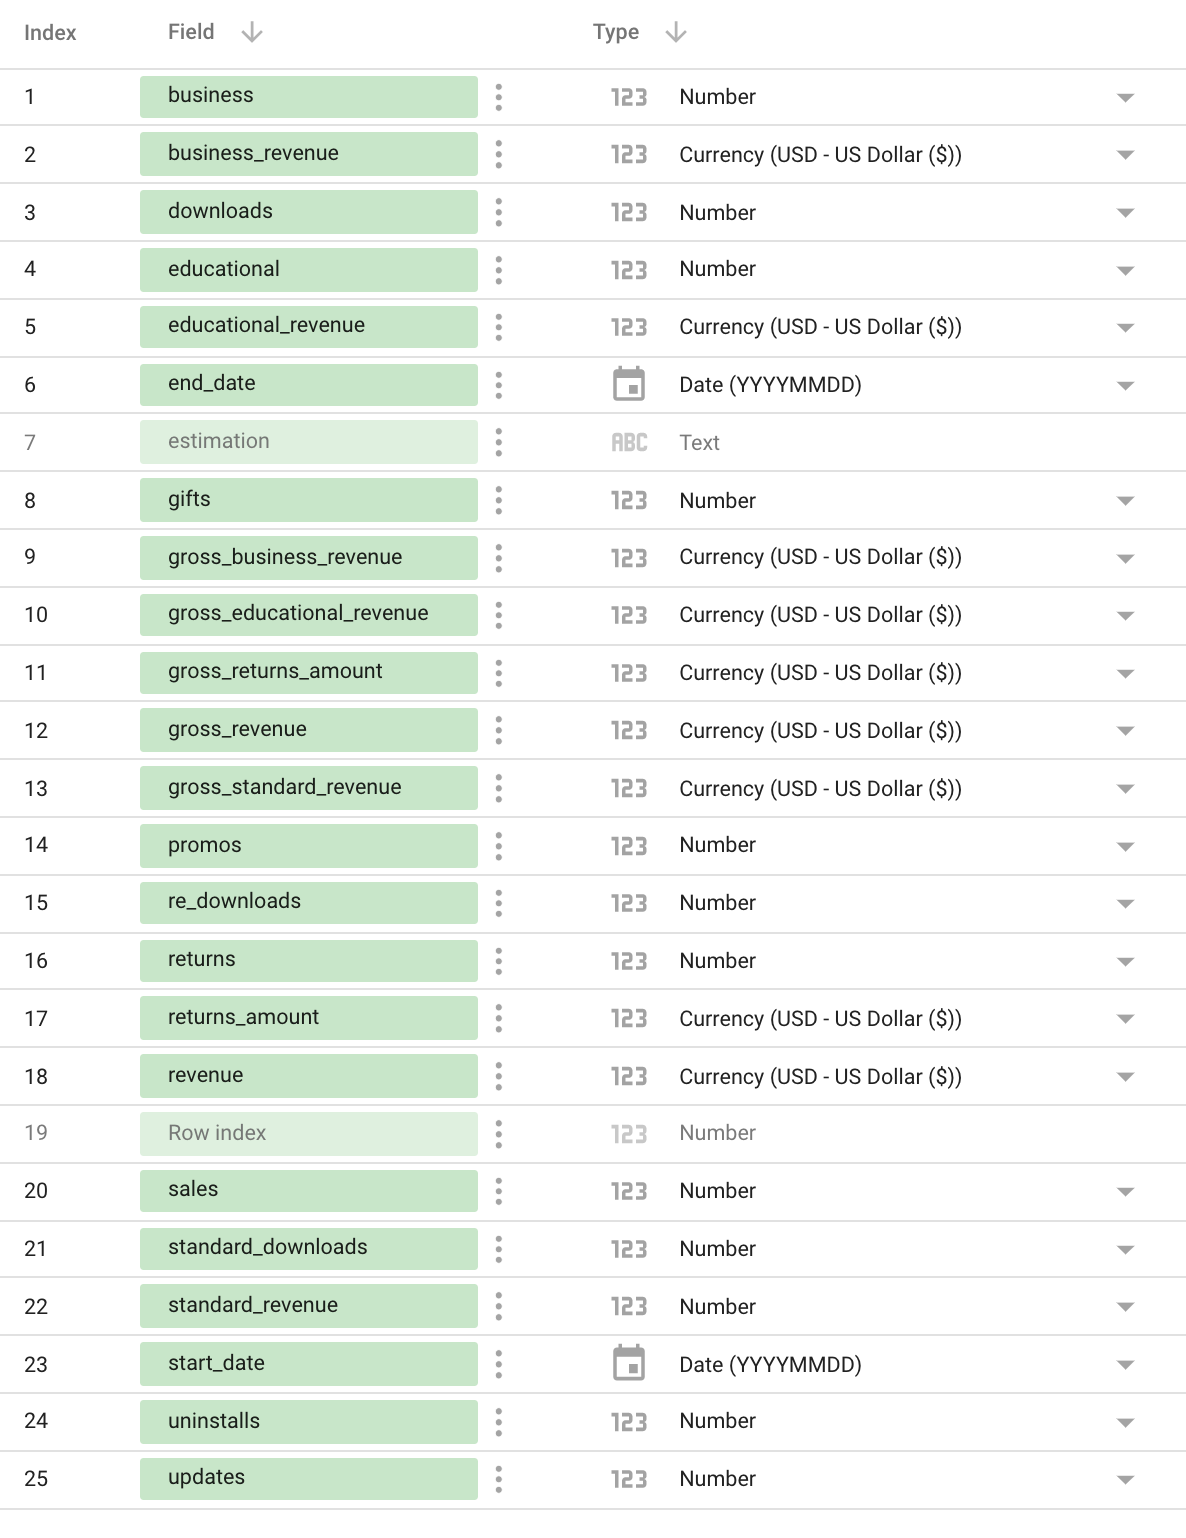
Review the list of metrics and ensure each field has the right type. The result should look like this:

Once done, click on “Create report” and start dashboardin'.
Getting more data into Google Data Studio
The Supermetrics connector for Google Data Studio is fairly generic, which means that you can get any data our API provides through it.
To do that, all you'll need to do is replace the Source in step 2 to a different API route. Here are a few popular options:
Ratings by day for all countries in the last 30 days: https://api.appfigures.com/v2/reports/ratings?start_date=-30&group_by=date&format=flat
One-star reviews from all countries/languages received in the last seven days: https://api.appfigures.com/v2/reviews?stars=1&start=-30&format=flat
Check out the API documentation to see all the routes and options the API supports.