GasBuddy Just Had Its Biggest Month Since Hurricane Milton

When the Strait of Hormuz crisis sent oil and gas prices higher in March, drivers went looking for cheaper stations, fast.
That sent GasBuddy, the long-running app for finding cheap gas nearby, into one of its biggest months in years. The obvious part is that higher prices led to more downloads. The interesting part is how big the response got, and how long it lasted.
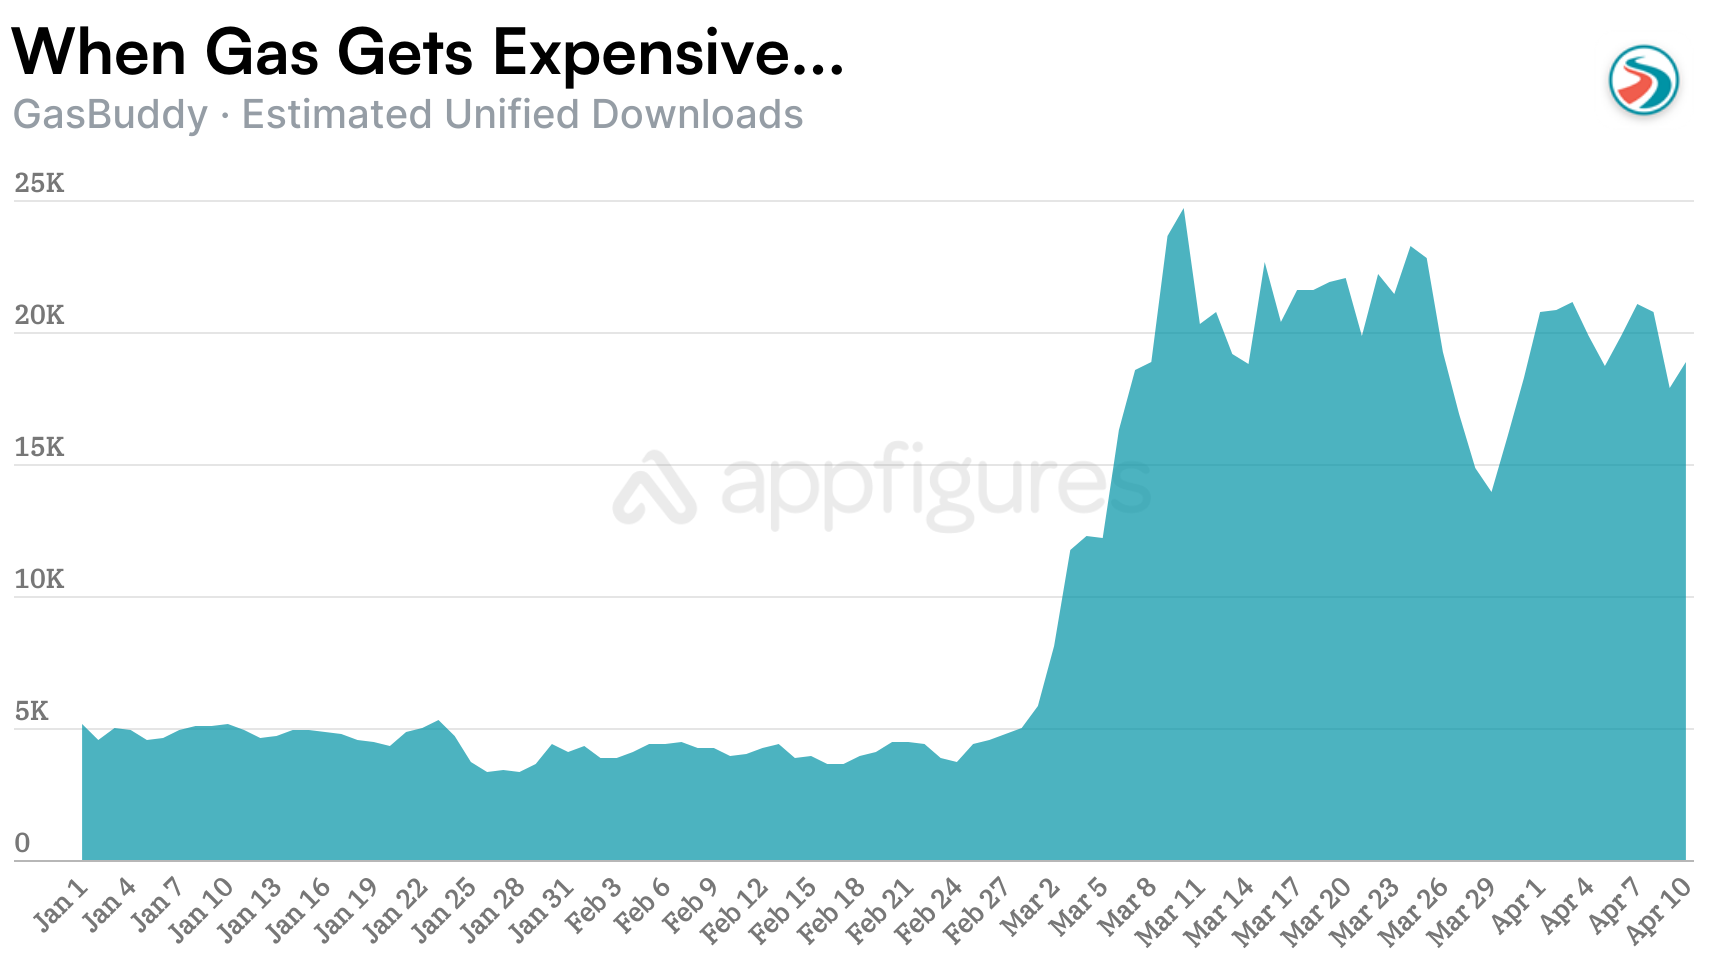
According to Appfigures Intelligence, GasBuddy averaged a little over 4K downloads a day in the second half of February across the App Store and Google Play. By March 10, downloads hit 25K in a single day.
March ended with 570K downloads, nearly 5x February's 117K. And even after the first rush cooled, the app still averaged just under 20K downloads a day in the first 10 days of April.
GasBuddy went from about 6K downloads on March 1 to 25K on March 10, then stayed elevated for weeks. From March 11 through March 25, our estimates show it still averaged about 21K downloads a day.
That kind of staying power is what makes this more than a one-day reaction to bad headlines. Drivers didn't just notice prices rising. More kept downloading the app as the pain at the pump spread.
For a category that rarely gets much attention, that's a big response, especially because most utility apps don't get many chances to remind people they exist, and GasBuddy gets one every time the price at the pump becomes painful enough to change behavior.
Bigger Than It Looks
GasBuddy helps people find cheaper gas. Gas got expensive. People downloaded GasBuddy. That part is easy.
What's less obvious is how large this category can get when pressure at the pump rises. Half a million downloads in a month is not small for a single-purpose utility that's been around for years. And because GasBuddy more or less owns this niche, it becomes a clean window into how real-world demand shows up in mobile.
From March 1 through April 10, about 71% of downloads came from the U.S. and roughly 29% came from Canada, according to our estimates. That shows the demand wasn't isolated to one market. Drivers across North America were reacting the same way.
The App Store led the surge with about 69% of downloads over that stretch, while Google Play made up the remaining 31%. For an app this practical, I would have expected a more even split, which makes the iPhone skew stand out.
This also isn't a flashy category or a crowded race. In plenty of markets, a spike like this would be split across several recognizable competitors. Here, most of the attention seems to flow to one name people already know. That makes GasBuddy feel less like a winner of one news cycle and more like the default tool for the category.
Bigger Than The Last Big Spike
This is also not the first time GasBuddy has surged when the real world gets messy.
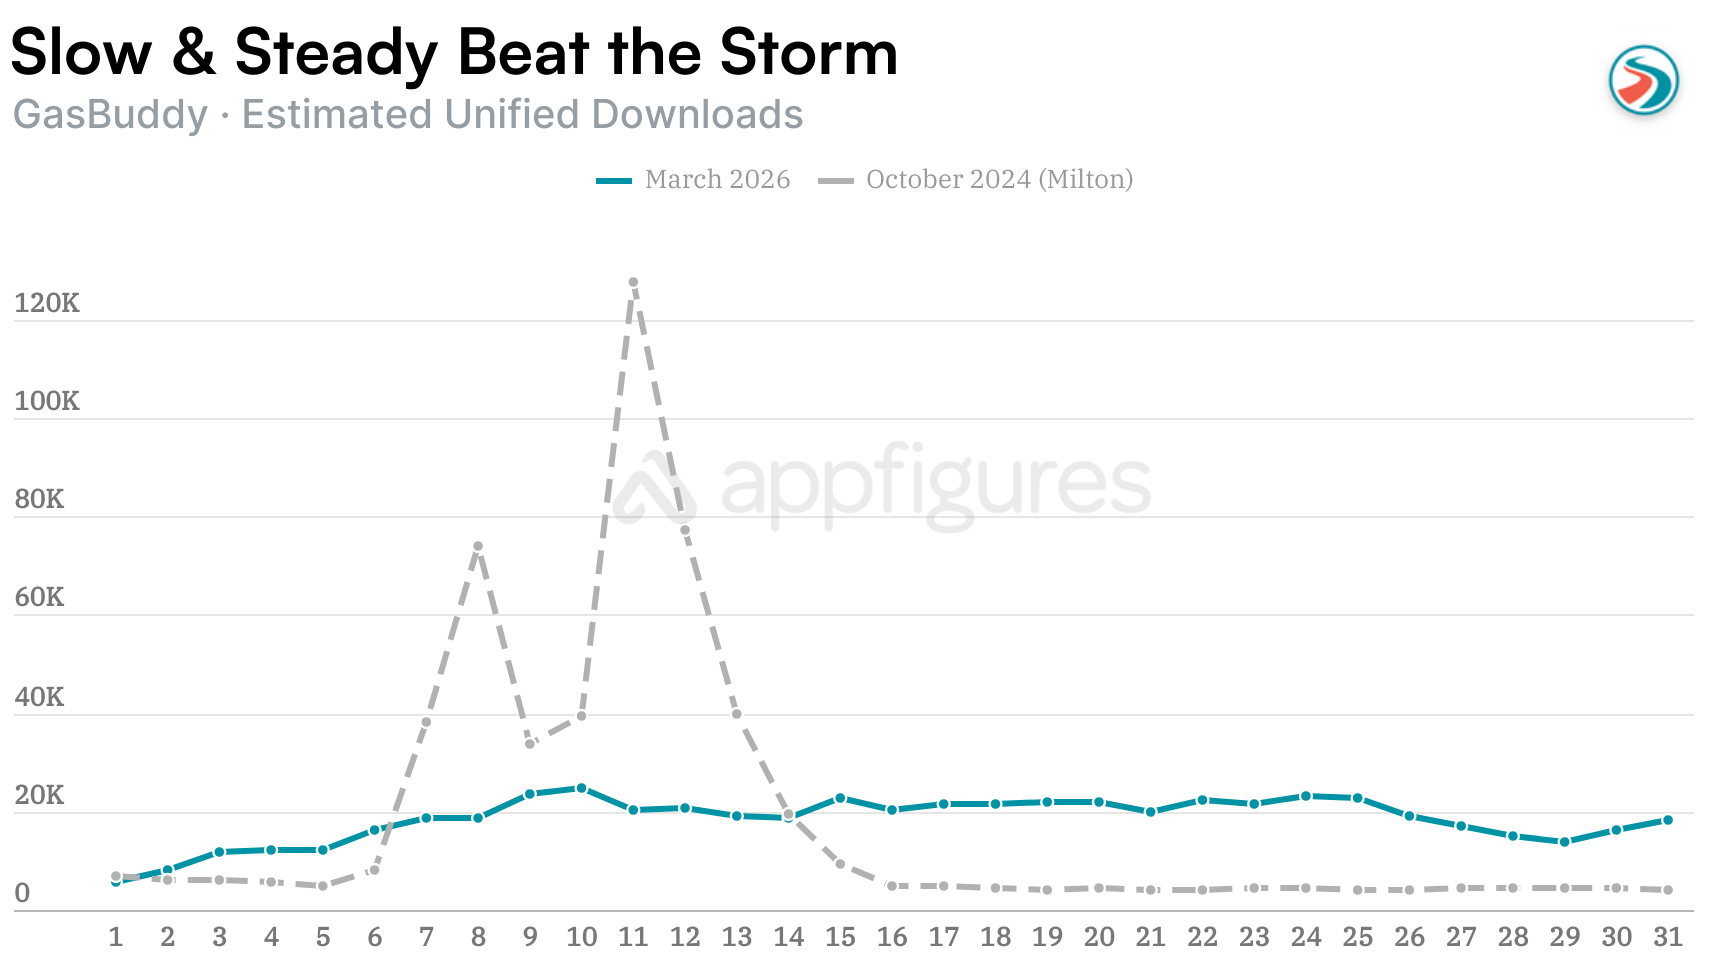
The last time the app had a month this big was October 2024, when Hurricane Milton pushed downloads to 567K. March's 570K was slightly bigger, but the shape was different. Milton was a sharper emergency spike tied to evacuation pressure and immediate shortages. This time, downloads climbed fast and then stayed high for weeks as gas prices kept climbing.
Every niche eventually gets a moment when something outside the app world sends people looking for help. The apps that win are usually the ones that were already there, already optimized, and already easy to find.
GasBuddy didn't need a new idea for this surge. It just had to be ready before it happened.
App Intelligence for Everyone!
The insights in this report come right out of our App Intelligence platform, which offers access to download and revenue estimates, installed SDKs, and more! Learn more about the tools or schedule a demo with our team to get started.
Are you a Journalist? You can get access to our app and market intelligence for free through the Appfigures for Journalists program. Contact us for more details.
All figures included in this report are estimated. Unless specified otherwise, estimated revenue is always net, meaning it's the amount the developer earned after Apple and Google took their fee.
