How to Connect Appfigures to Google Sheets
At the moment, there's no native connector to get data from Appfigures into Google Sheets, but that doesn't mean you can't connect the two!
You'll be able to do that with Google's Script Engine and a custom script.
Here's how to do that:
- Open your Google Sheet. A new one is best but not necessary.
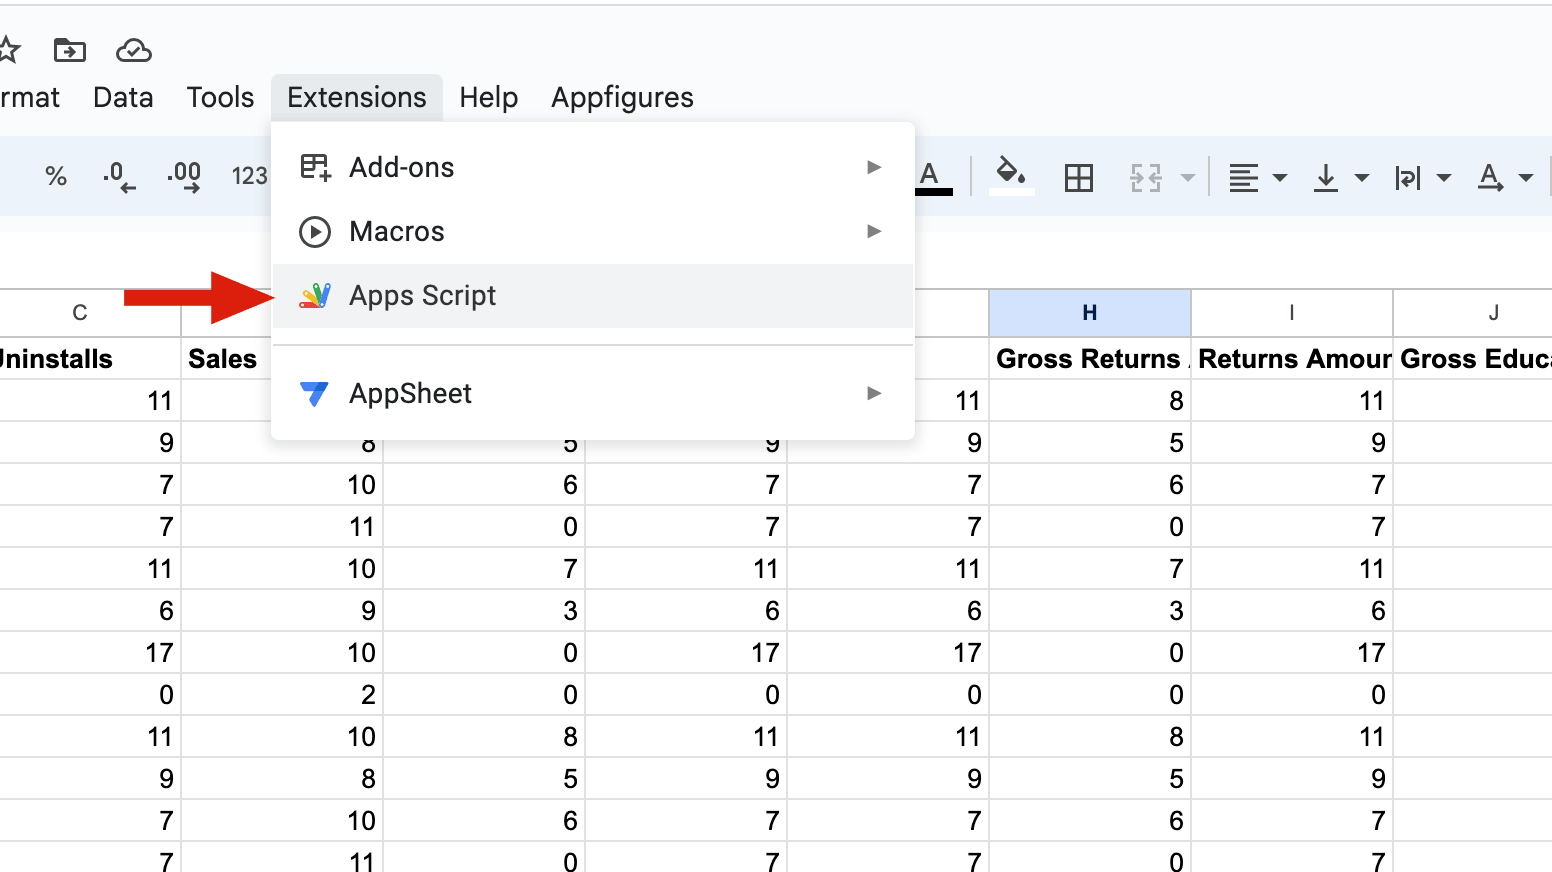
- Open the script editor by navigating to
Extensions→Apps Script
- Give the script a name in the left menu by clicking three dots of
Code.gsthen rename.AF APIis a good default. - Copy the following script, as-is, into the editor
This file contains bidirectional Unicode text that may be interpreted or compiled differently than what appears below. To review, open the file in an editor that reveals hidden Unicode characters.
Learn more about bidirectional Unicode characters
| // __ _ | |
| // __ _ _ __ _ __ / _|(_) __ _ _ _ _ __ ___ ___ | |
| // / _` || '_ \ | '_ \ | |_ | | / _` || | | || '__|/ _ \/ __| | |
| // | (_| || |_) || |_) || _|| || (_| || |_| || | | __/\__ \ | |
| // \__,_|| .__/ | .__/ |_| |_| \__, | \__,_||_| \___||___/ | |
| // |_| |_| |___/ | |
| // VERSION 1.2 | |
| // Instructions: https://appfigures.com/support/kb/691/how-to-connect-appfigures-to-google-sheets | |
| // Your personal access token. See instructions for more info. | |
| var appfiguresKey = '<YOUR PERSONAL ACCESS TOKEN>'; | |
| // The number of days to pull data for | |
| var days = 7; | |
| // The way data will be grouped. Separate multiple options with a comma. Options: date, country, product | |
| var grouping = 'date'; | |
| // Product IDs of apps to include, separated by a comma. Leave blank to include all apps in your account. | |
| var products = ''; | |
| // Whether new data will be appended to the sheet or overwrite any existing data. Options: overwrite, append | |
| var mode = 'append'; | |
| // ---------- // | |
| function createMenu() { | |
| var ui = SpreadsheetApp.getUi(); | |
| ui.createMenu('Appfigures') | |
| .addItem('Get Sales','getSales') | |
| .addItem('Get Revenue','getRevenue') | |
| .addItem('Get Ratings','getRatings') | |
| .addItem('Get Subscriptions','getSubscriptions') | |
| .addItem('Get Reviews','getReviews') | |
| .addToUi(); | |
| } | |
| function getSales() { | |
| getAppfiguresData('reports/sales'); | |
| } | |
| function getRevenue() { | |
| getAppfiguresData('reports/revenue'); | |
| } | |
| function getRatings() { | |
| getAppfiguresData('reports/ratings'); | |
| } | |
| function getSubscriptions() { | |
| getAppfiguresData('reports/subscriptions'); | |
| } | |
| function getReviews() { | |
| getAppfiguresData('reviews'); | |
| } | |
| function getAppfiguresData(dataset) { | |
| if(!dataset) dataset = 'reports/sales'; | |
| var querystring = getQsParams(dataset); | |
| var json = UrlFetchApp.fetch('http://api.appfigures.com/v2/' + dataset + '?' + querystring); | |
| var data = JSON.parse(json.getContentText()); | |
| // Figure out all the datasets we have in the response | |
| var headers = Object.keys(getRoot(dataset, data)[0]); | |
| // Find the first empty row. We'll use this later | |
| var firstEmptyRow = getFirstEmptyRowWholeRow(); | |
| var gs = SpreadsheetApp.getActiveSpreadsheet(); | |
| var sheet = gs.getActiveSheet(); | |
| // Create the headers, if needed | |
| if(createHeaders(headers, sheet, firstEmptyRow)) { | |
| firstEmptyRow++; | |
| } | |
| // Insert or append new data | |
| // NOTE: This code can't handle changes to the order of columns. | |
| // It could, but it doesn't... | |
| getRoot(dataset, data).forEach(function(item, i) { | |
| var row = i; | |
| if(mode == 'overwrite') { row = i + 2; } else { row = i + firstEmptyRow; } | |
| headers.forEach(function(header, h) { | |
| sheet.getRange(row, h + 1).setValue(item[header]); | |
| }); | |
| }); | |
| } | |
| function getQsParams(dataset) { | |
| var qs = ''; | |
| if(dataset == 'reviews') { | |
| qs = 'start=-' + days + '&products=' + products; | |
| } else { | |
| qs = 'start_date=-' + days + '&group_by=' + grouping + '&format=flat&products=' + products; | |
| } | |
| qs += '&access_token=' + appfiguresKey; | |
| return qs; | |
| } | |
| function getRoot(dataset, data) { | |
| if(dataset == 'reviews') { | |
| return data['reviews']; | |
| } else { | |
| return data; | |
| } | |
| } | |
| function titleCase(s) { | |
| s = s.toLowerCase().split(' '); | |
| for (var i = 0; i < s.length; i++) { | |
| s[i] = s[i].charAt(0).toUpperCase() + s[i].slice(1); | |
| } | |
| return s.join(' '); | |
| } | |
| function getFirstEmptyRowWholeRow() { | |
| var sheet = SpreadsheetApp.getActiveSheet(); | |
| var range = sheet.getDataRange(); | |
| var values = range.getValues(); | |
| var row = 0; | |
| for (var row=0; row<values.length; row++) { | |
| if (!values[row].join("")) break; | |
| } | |
| return (row+1); | |
| } | |
| function createHeaders(headers, sheet, firstEmptyRow) { | |
| // check mode. if overwrite always add it, if append | |
| // check if there's something in row 0 and only write if it's empty | |
| if(mode == 'overwrite' || (mode == 'append' && firstEmptyRow == 1)) { | |
| headers.forEach(function(header, h) { | |
| var name = titleCase(header.replaceAll("_", " ")); | |
| sheet.getRange(1, h + 1).setValue(name).setFontWeight("bold"); | |
| }); | |
| return true; | |
| } else { | |
| return false; | |
| } | |
| } |
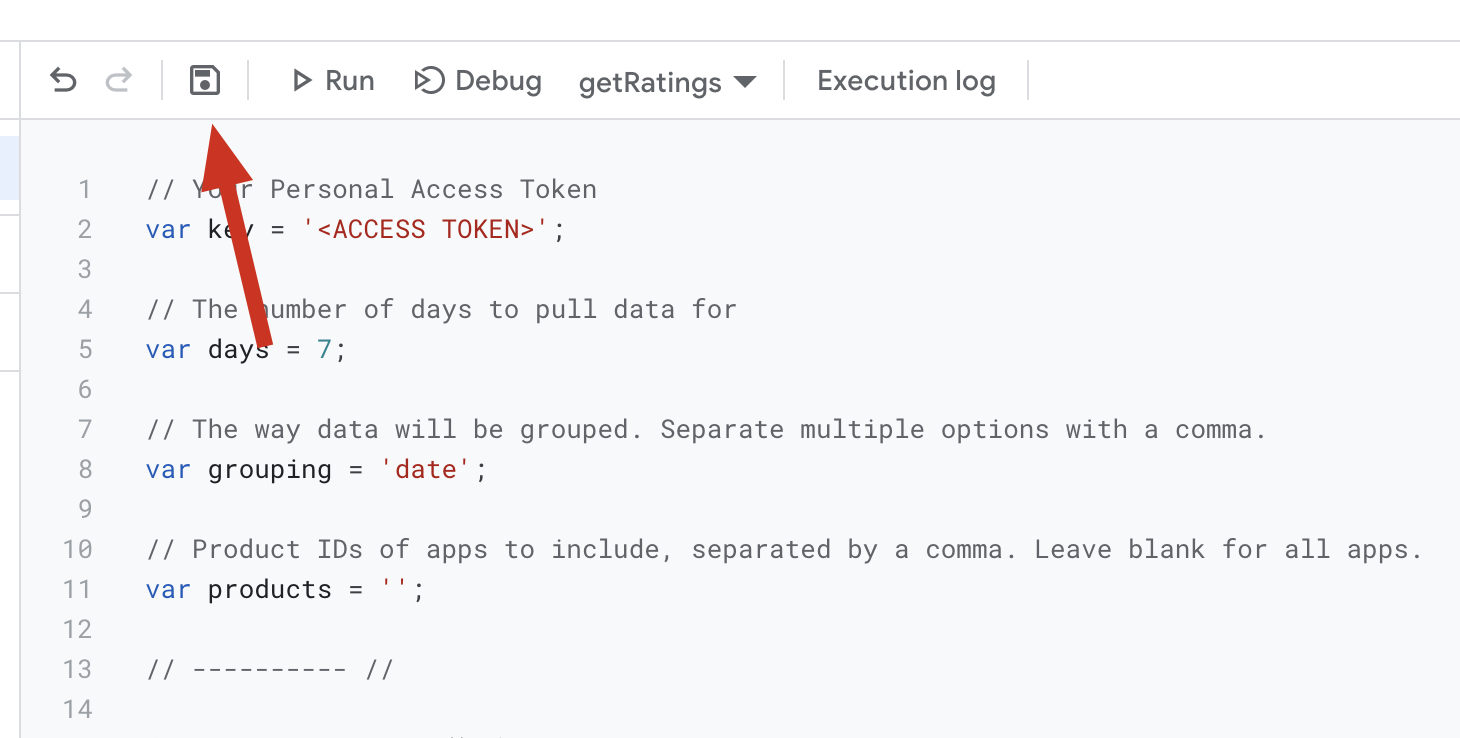
- Set your access token. Click here to learn how to generate it

- Customize (optional):
- Days - The number of days you want pulled every time you load data. The default is 7.
- Grouping - How the data will be broken down. Options include
date,country,storefront, andproduct. Multiple options can be specified, separated by a comma. By default, data will be grouped by date. - Products - The Product Ids of the apps you want to pull data for. By default (blank) all apps will be included.
- Mode - How to introduce new data into the sheet. Options:
append,overwrite.
- Save the project.
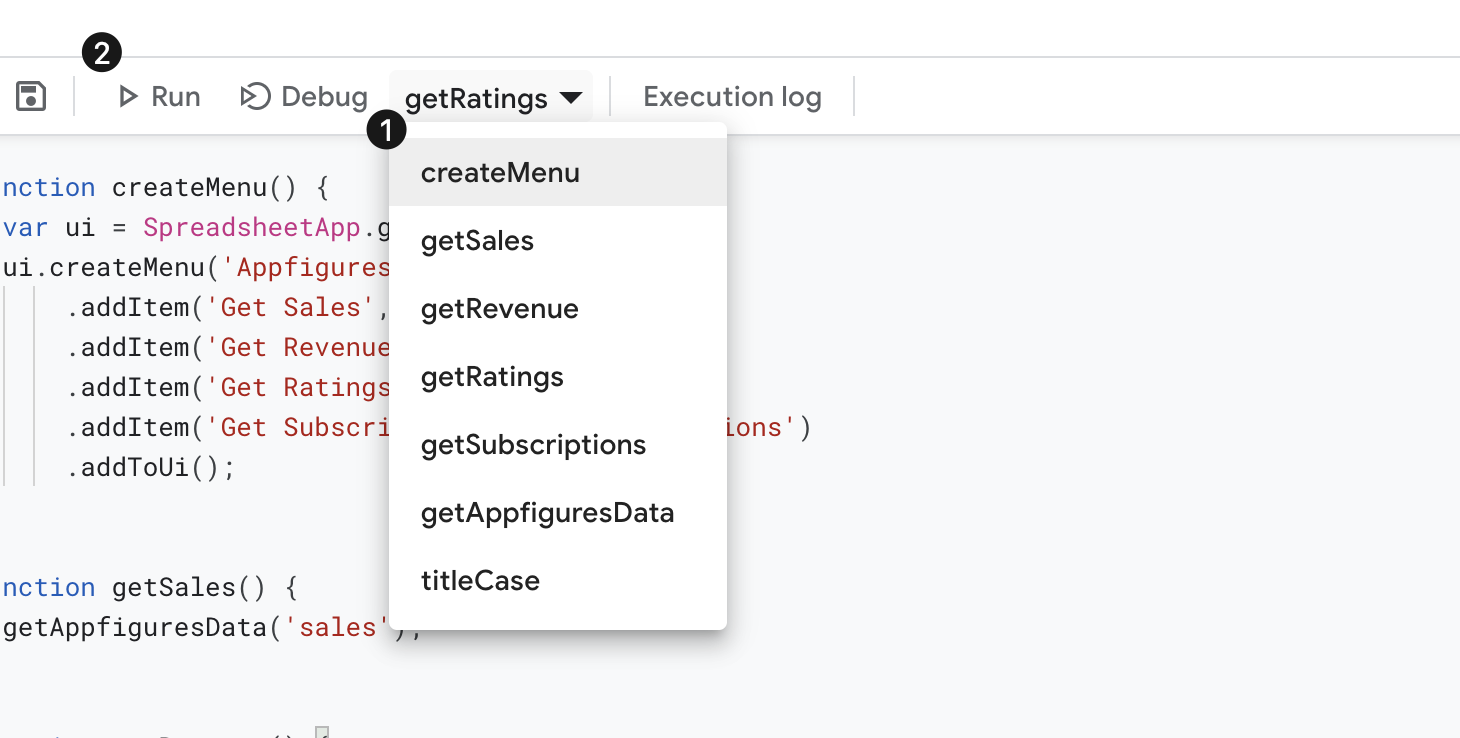
- Select the
createMenufunction from the top dropdown and hit "Run" to set things up. This one's important.
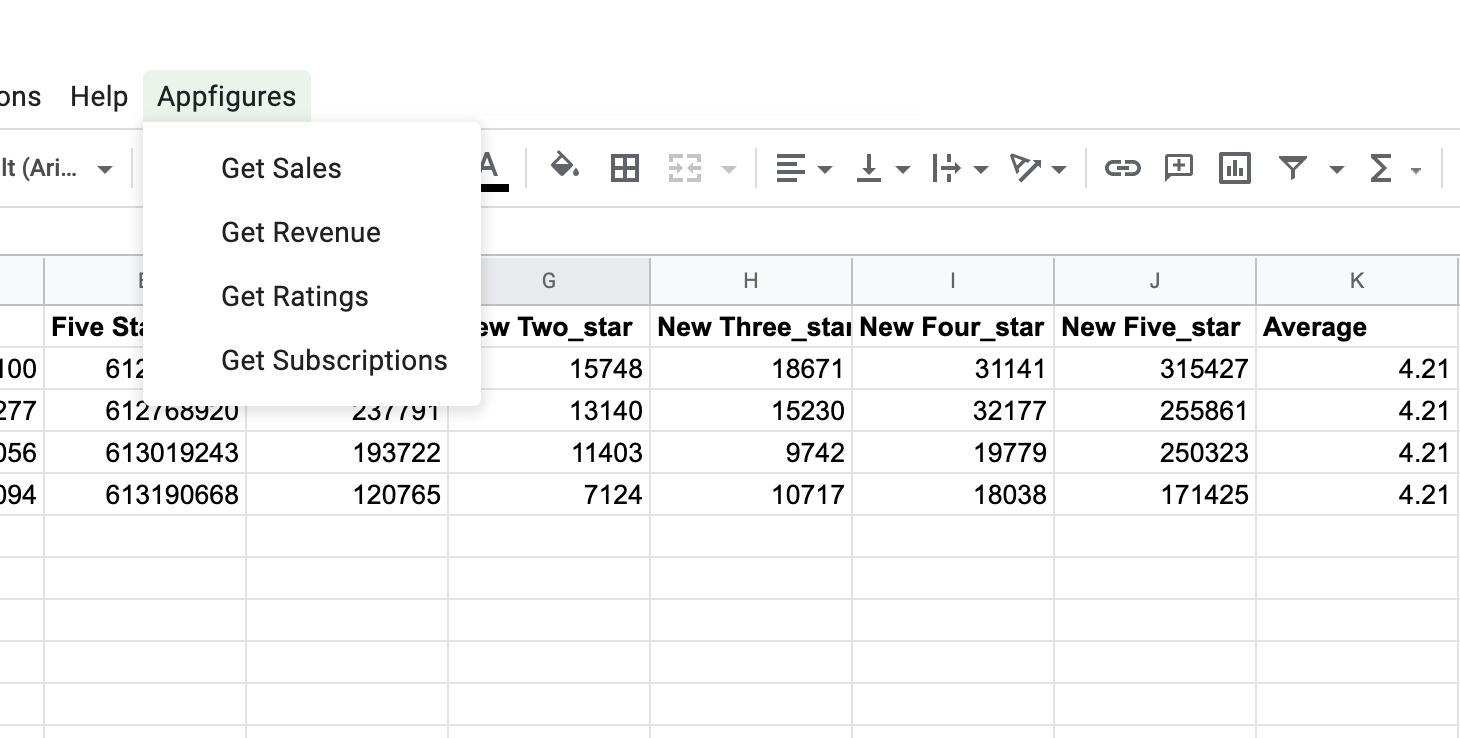
- Head back to your Google Sheet and you'll see a new
Appfiguresoption in your menu. All you have to do now is select the data you want to bring into your Google Sheet and vóila!
Tinkering further
This is a pretty simple and generic way to pull data from the Appfigures API into Google Sheets. It can be further customized and other data sets can be added to it as well beyond the ones available in this script.
Check out the API docs to see what the API can do.