Comparing Revenue from the Payments Report to the Sales Report
Apple has a somewhat unintuitive system for reporting revenue to developers. There are several reports available from Apple, some working with different date ranges and separate release schedules.
Appfigures simplifies this using the Payments report. The report calculates the most accurate revenue based on what's available from Apple so you don't have to.
Knowing what is available and understanding what's included in the reports will help when comparing between the sales reports and the payments report in Appfigures.
Reports Available from Apple:
- Daily - released every each day, with data for the previous day.
- Financial - released roughly two weeks after the end of the fiscal month. This report is released by region, which Apple uses for making payments to developers.
- Payments - release roughly five weeks after the end of Apple's fiscal month and includes a single sum of the what you've been paid by Apple.
Understanding the Payments report:
Each of the three columns is based on a specific report Apple releases from above.
- Estimated column = Daily report
- Actual column = Financial report
- Paid column = Payments report (not available in the sales report)
In the Payments report, all columns for iOS apps automatically snap to Apple's fiscal calendar to match the dates used within Apple's financial and payments reports.
More on the payments report here.
Here are a few examples to put this into context.
For Apple, October 2024 started on September 30th and ended on November 2nd. November started on November 3rd and ended on November 30th, and December started on December 1st and ended on December 28th.
Here's Apple's full calendar for 2025
Let's take a look at how we can compare these reports:
Sales Report with Apple's Fiscal Calendar

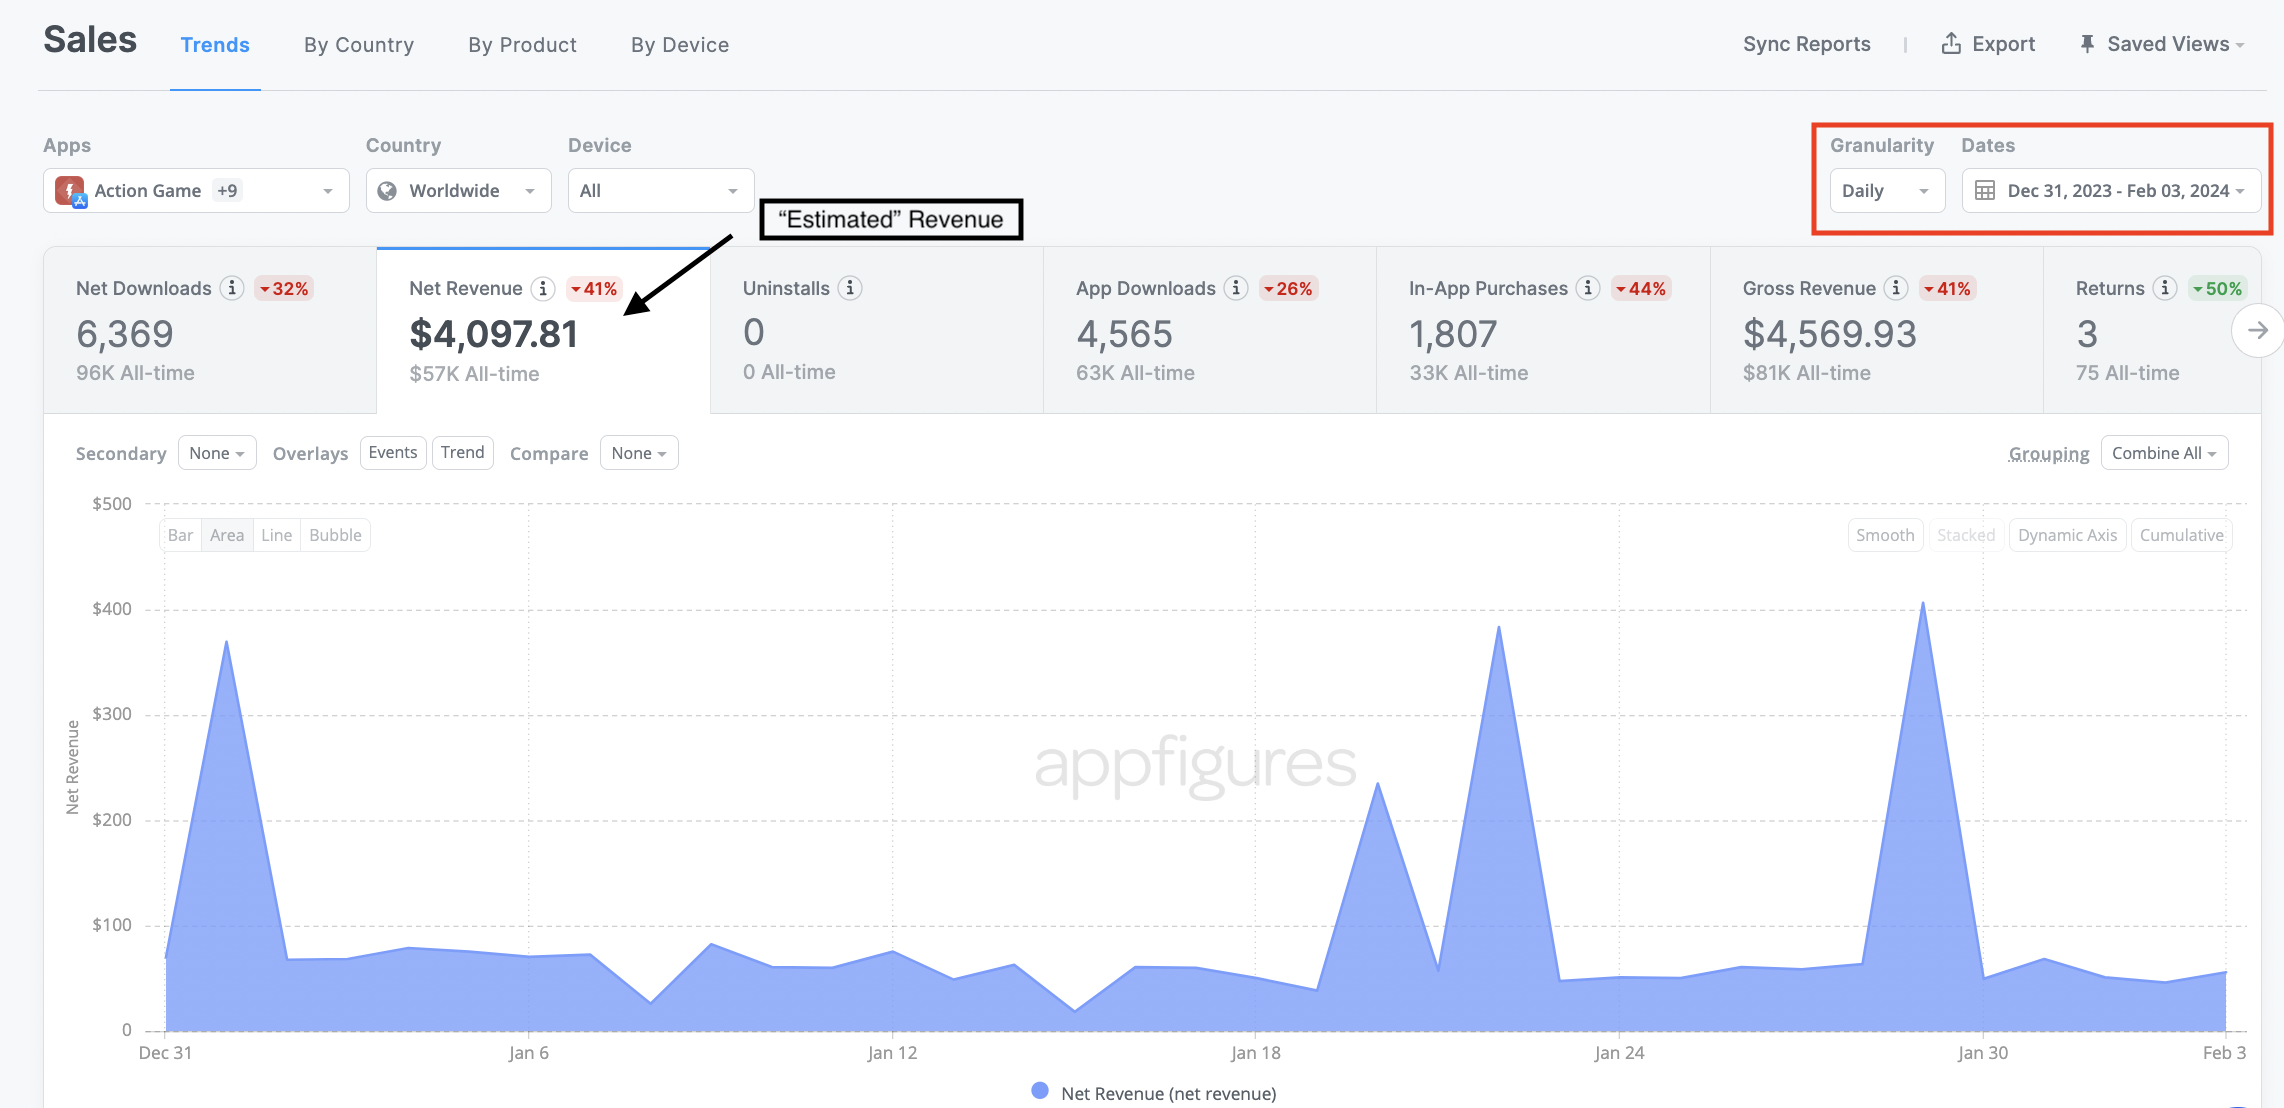
In the Daily granularity, if we manually set up the dates to match that of Apple's fiscal calendar for January then we'd then see that the Estimated net revenue is $4,097.81.
Sales Report with Traditional Monthly Calendar

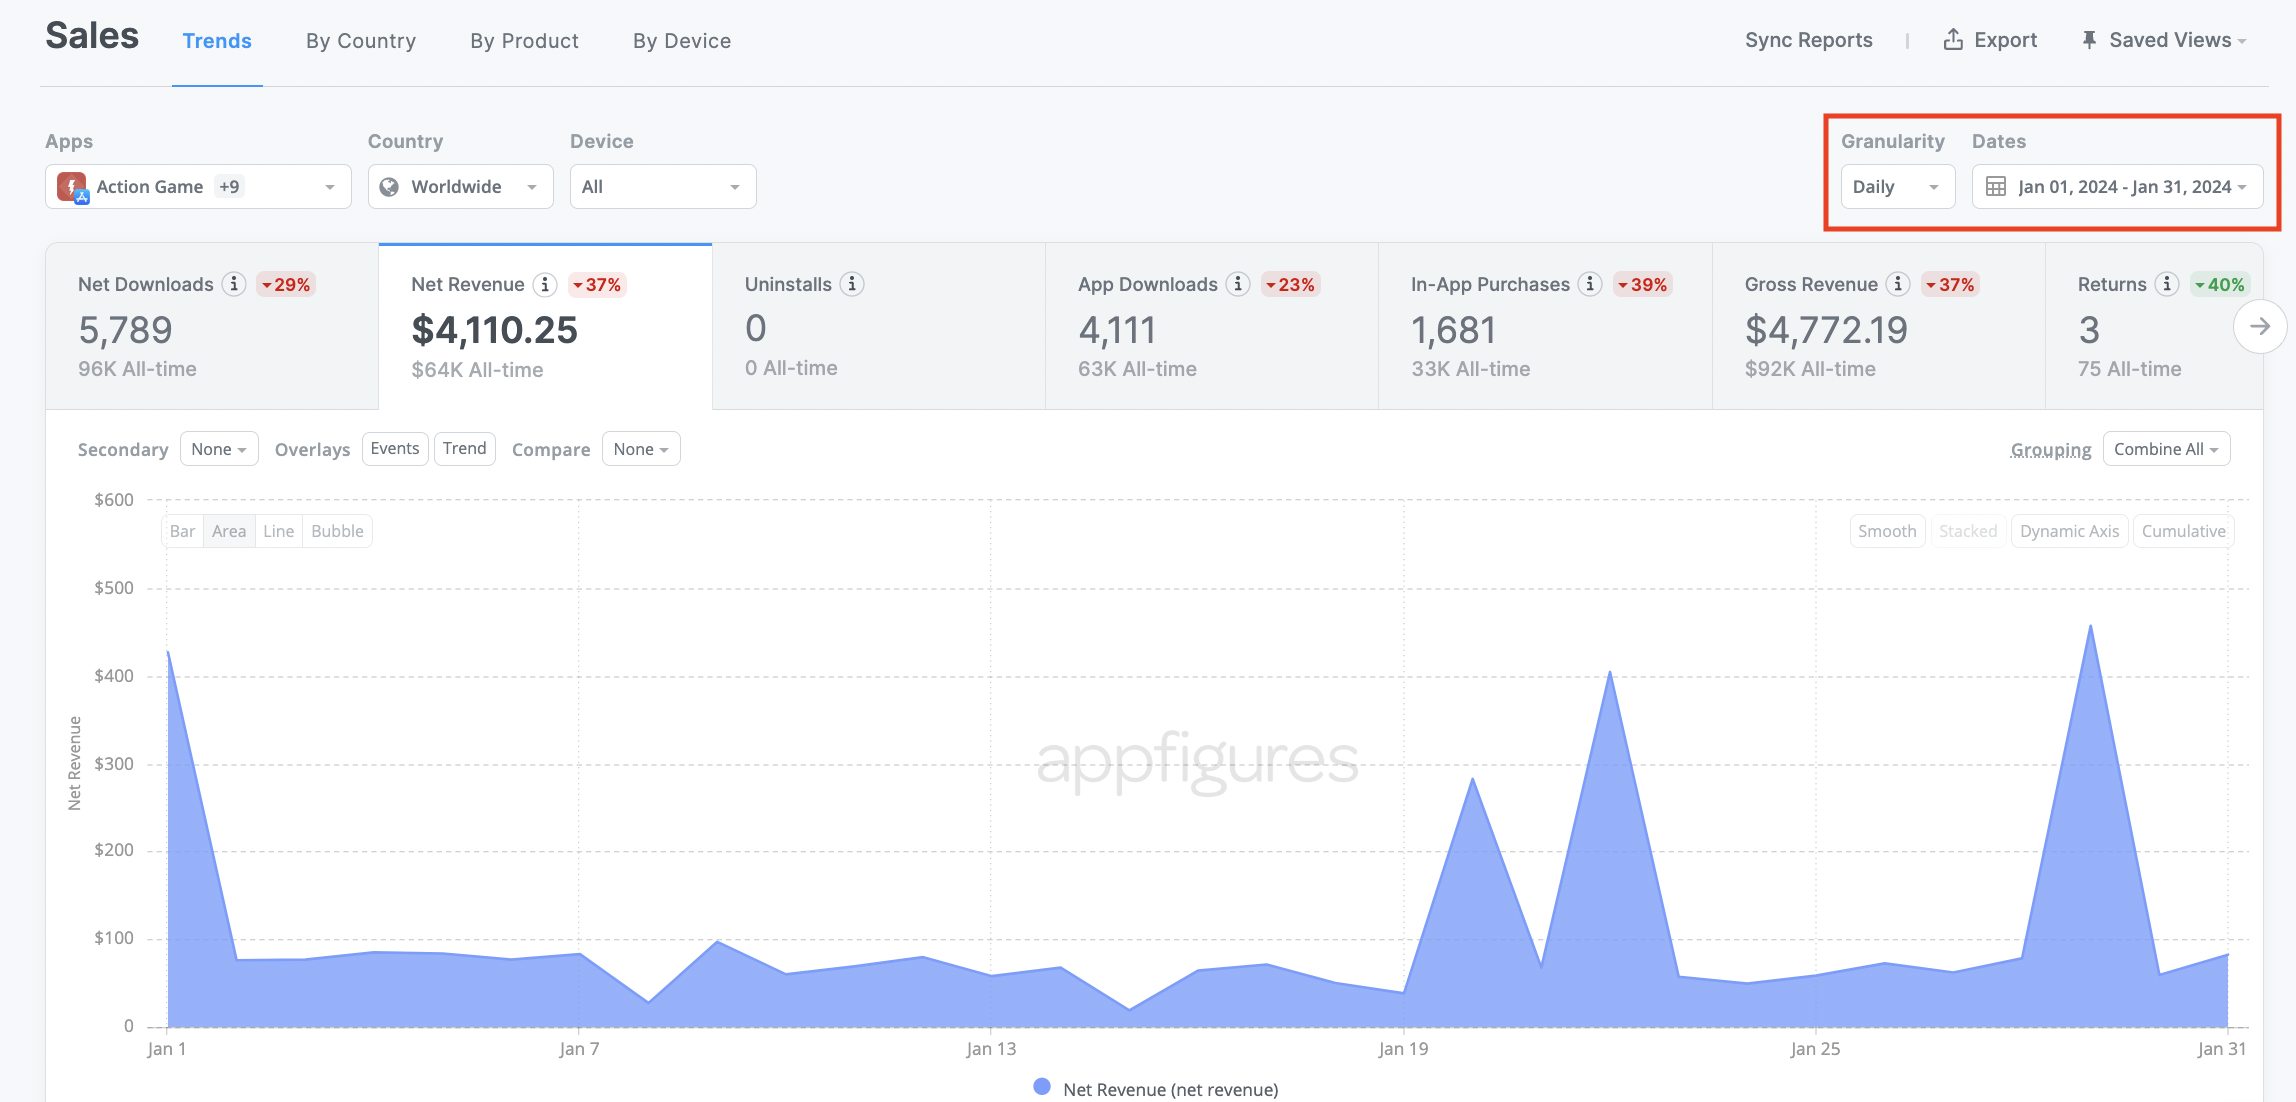
However, the screenshot above is what your net revenue would look like in the Daily granularity if the dates were set up according to the traditional monthly calendar.
The Estimated net revenue is listed as $4,110.25.
Sales Report set to the Financial Granularity

For the Actual net revenue you'll need to go the granularity menu in the Sales report and choose Financial.
From there you'll see that the net revenue is listed as $4,093.08.
Payments Report
Now that you know how to compare the Estimated and Actual net revenue in your Sales report to Payments, let's take a look at what you were paid.

The Paid revenue is found in the third column of your Payments report (as shown above). For the month of January you were paid a total of $4,089.75.
And that's it! Comparing your revenue in Payments with that in the Sales report is simple once you know what granularity and dates to look at.